Sponsoring companies
![]()
![]()

![]()


![]()
Dynamic Modelling Case Study
The aim is to develop and demonstrate a stepwise prospectivity mapping starting from regional scale conceptual model moving to belt scale model and ending up target scale prospectivity model for orogenic gold deposits. The data for the regional scale model is the same that is provided as demo data set with the new SDM tool set albeit in higher resolution. For the target scale model, the modeling was carried out using publicly available data from the Saattopora Au-Cu deposit and the exploration camp site surrounding it. The resulting prospecitivity maps illustrate the capability of the stepwise method to narrowing down the prospective areas in each step, in the final stage down to drill target size areas.
The case study shows that the prospectivity modeling is a scalable, fast, and cost effective tool supporting decision making in all the stages of an exploration project – from selecting the most prospective belts to outlining drilling targets. The prospectivity models can be easily adjusted for different scales and adaption of different data sets is relatively an easy process.

Dynamic modeling case study prospectivity maps for orogenic gold deposits: a. regional scale, b. belt scale, b. target scale. Diamonds mark the location of known orogenic gold deposits and occurrences. Black polygons the locations of the belt, and target scale maps, respectively. Favorability scale is the same in all maps.
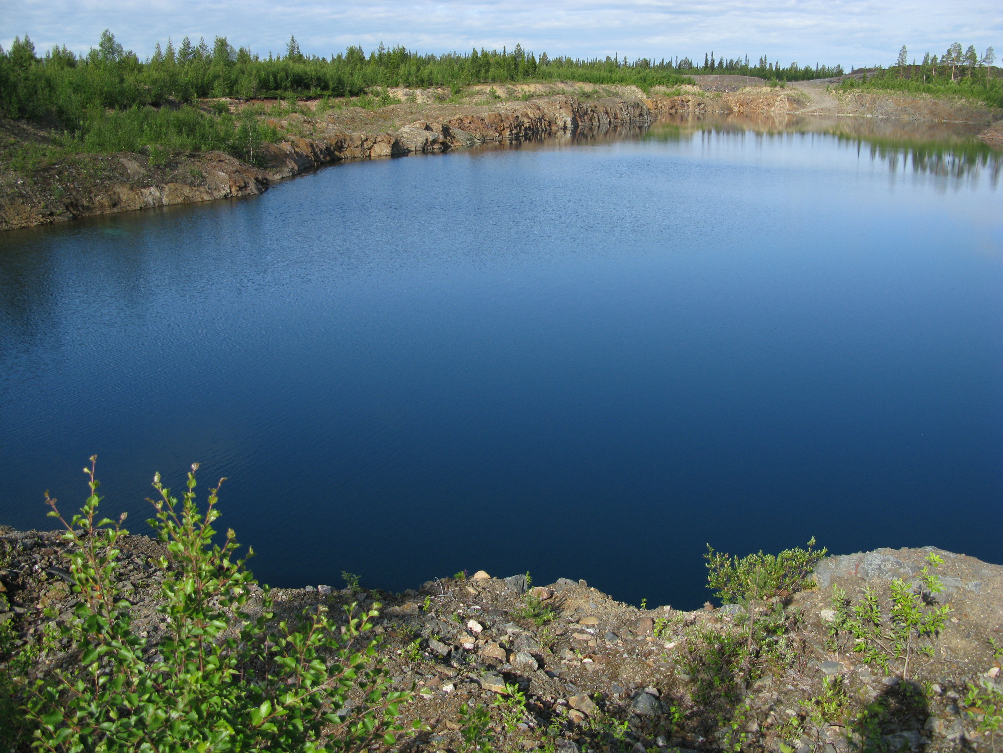
Water filled open pit of the Saattopora Au-Cu deposit in Central Lapland greenstone belt in 2009. Photo: Tero Niiranen (GTK)
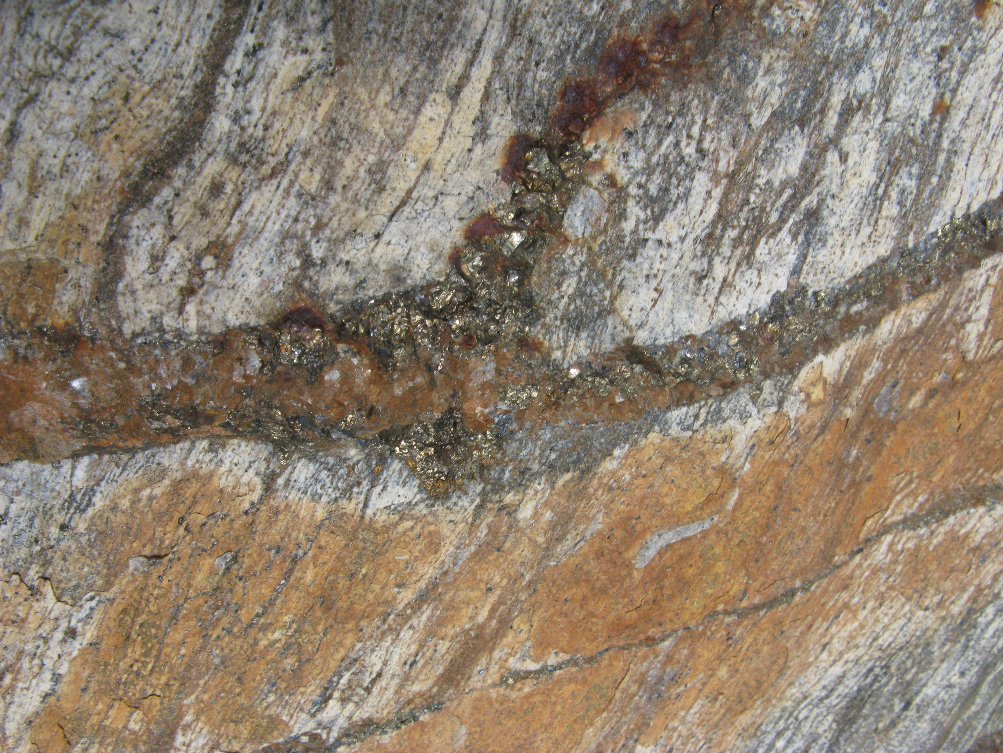
A typical gold-hosting quartz-carbonate-sulfide vein in albitized phyllite at Saattopora. Short side of the photo corresponds to c. 15 cm. Photo: Tero Niiranen (GTK)


